In this article, you will learn several ways to measure the peak performance of a wind generator. One way to measure peak performance is to use a table or graph of a wind turbine power curve.
Another way is to measure the amount of usable energy (power produced over time) that the wind system produces in the wind conditions at a site.
Wind Turbine Peak Performance
Wind turbine peak performance occurs when the output of the wind turbine generator is at or above its rated output.
One way to measure peak performance is to use a graph of a power curve. A power curve is a graph that shows the wind speed and the output power of the wind turbine over a range of wind speeds from zero to the maximum wind speed for which the wind turbine is designed.
Figure 1 shows a graph of a power curve for a wind turbine. On this graph, the wind speed is shown on the x-axis of the graph from 2 to 21 m/s.
The output of the generator is shown on the y-axis on the left side, and it indicates power in kilowatts from 0 to 70 kW.
According to this power curve, the wind turbine produces its maximum output of 63 kW to 65 kW when the wind is about 17 m/s.
Although the power in the wind increases considerably as wind speed goes up, the turbine is designed not to exceed its rated power after some point.
Each wind turbine manufacturer tests its models and produces a power curve for prospective buyers. This information allows a comparison with similar models from different manufacturers.
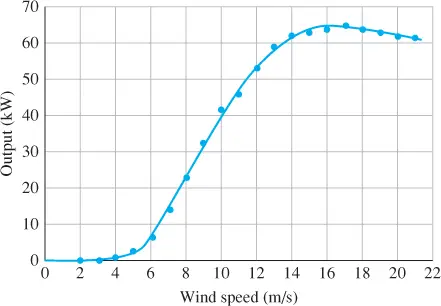
Figure 1 Generator Output for a 65 kW Wind Turbine
The test to create the official power curve for a specific wind turbine is designed to keep as many factors constant as possible so that comparisons of power output among different models of wind turbines can be made.
When a wind turbine is put on a specific site, other issues change the power output of the wind turbine. Examples of such issues are the icing of the blades in cold weather, dirt on the blades, and even insect impacts that have not been removed by rain or cleaning for long periods of time.
Each of these issues may change the actual power output of the wind turbine so that it is lower by 1% to 2% from the rating indicated on the published power curve.
The data from the graph can also be shown in a table. Table 1 shows the data from the graph shown in Figure 1.
The wind speed is shown in m/s in the first column and the wind speed is shown in mph in the second column. The power output is shown in kW in the last column.
| Wind Speed (m/s) | Wind Speed (mph) | Power (kW) |
| 2 | 4.5 | 0 |
| 3 | 6.7 | 0 |
| 4 | 8.8 | 0.7 |
| 5 | 11.2 | 2.2 |
| 6 | 13.4 | 6.5 |
| 7 | 15.6 | 13.8 |
| 8 | 17.9 | 22.7 |
| 9 | 20.1 | 32.1 |
| 10 | 22.4 | 41.3 |
| 11 | 24.6 | 46.5 |
| 12 | 26.8 | 52.8 |
| 13 | 29.1 | 58.7 |
| 14 | 31.3 | 61.7 |
| 15 | 33.5 | 62.9 |
| 16 | 35.8 | 63.8 |
| 17 | 38 | 64.7 |
| 18 | 40.2 | 63.5 |
| 19 | 42.5 | 62.6 |
| 20 | 44.7 | 61.7 |
| 21 | 46.9 | 61.2 |
Table 1 Wind Speed and Generator Output Data for Calculating a Power Curve for a Wind Turbine
Wind Turbine Power Example 1
Use Table 1 to determine the amount of electrical power the wind turbine produces when the wind speed is 10 m/s. What is the speed of the wind in mph when the wind blows at 10 m/s?
Solution
From Table 1, the power the generator produces at a wind speed of 10 m/s is 41.3 kW. The wind speed in mph is 22.4 mph.
Wind Turbine Power Example 2
Use Table 1 to determine the amount of electrical power the wind turbine produces when the wind speed is 38 mph. What is the speed of the wind in m/s when the wind is blowing 38 mph?
Solution
From Table 1, the power the generator produces at a wind speed of 38 mph is 64.7 kW. The wind speed in m/s is 17 m/s.
A second way to measure peak performance includes air density. Density (ρ) is the mass (m) per volume (Vol) of a substance and is written in equation form as follows:
\[\rho =m\times Vol\]
Where
ρ is the density in kg/m3
m is the mass in kg
Vol is the volume in m3
Air density (ρa) is a measure of how much mass is contained in a specific volume of air.
The amount of moisture (humidity) in the air, the air pressure, and the temperature all affect the air density. Air is denser when it is cooled; it also changes with humidity. When the air is dense, the output of the wind turbine increases.
Application of Wind Turbine Power Curves
The wind power curve indicates how much power a wind turbine should produce at any given wind speed.
The maximum value from the wind power curve may be used in marketing wind turbines and for comparisons between competing models, so the values are sometimes higher than the actual output.
If you are using power curves as part of a purchasing decision, you may want to request actual performance data from several installed wind turbines.
Some manufacturers use projections and calculations to determine the values on the wind power curve, which may make their projections higher than the output is in real-world applications.
The rated power is used to compare similar wind turbines under standard conditions.
Peak power is the amount of electrical power the wind turbine can produce at the highest rated wind speed.
The wind turbine may not be able to produce power on a continual basis at the peak power rating because wind speeds that high do not normally occur on a continual basis, and the wind turbine generator and gearbox may not able to handle that exceptional load for any sustained period of time.
Testing by Independent Laboratories
Power curve testing should be done by independent testing laboratories as well as by manufacturers. If the data is a set of testing criteria, the same type of data must be collected for different models.
Testing agencies are set up throughout the world for these tests. In the United States, one government agency that performs testing is the National Renewable Energy Laboratory (NREL) of the US Department of Energy (DOE).
NREL provides tests in conjunction with other agencies such as the National Aeronautics and Space Administration (NASA). NASA has a large wind tunnel located at Moffett Field in California.
A wind tunnel is a testing laboratory designed specifically to create large wind flows under controlled conditions.
Originally, wind tunnels were used to test aircraft wings and aircraft stability under operating conditions. The wind tunnel is a large dome filled with compressed air; the air is slowly released to pass through a tunnel where the wind turbine blades and rotor are positioned.
The release of the air into the wind tunnel creates a realistic simulation of wind blowing at the height and level where a wind turbine would normally be located on top of its tower.
Because the wind turbine is mounted near the ground in the tunnel, it can easily have a large number of sensors connected to it to provide vast amounts of data when it is under load.
The wind tunnel at Moffett Field is 24.4 m × 36.6 m (80 ft × 120 ft) in the area, and it can produce low- and medium-wind speeds to test wind turbines.
The data from these tests is very important because it is collected by a scientific laboratory that is entirely independent of any manufacturer.
Measuring Generator Output
Another major part of determining the performance of a wind turbine is to measure the efficiency of the generator.
The output of the electrical generator changes with the shaft rotational speed. The field current of some generators can be adjusted so that their efficiency remains fairly constant over a range of speeds.
When the generator efficiency varies with speed, the generator speed may not be optimized for a given turbine speed, which makes the overall efficiency of the wind turbine less than its rating.
A double peak in the output power may occur at different wind speeds: the first when the turbine blades reach their maximum efficiency and the second when the generator reaches its maximum output.
Wind Turbine Power Curve Review Questions
- What is a wind power curve?
- List two independent testing centers for testing wind turbine power curves.
- Explain the importance of using actual measured data to compare the efficiency of two wind turbines rather than using projected data.
- What causes the output of a generator to change? What can be adjusted to make the generator efficiency fairly constant?
Answers
- A curve that relates wind speed to output power
- In the United States, the National Renewable Energy Laboratory (NREL) and National Aeronautics and Space Administration (NASA)
- Many variables affect performance; measured data allows potential buyers to compare turbines.
- Variations in the shaft speed change the generator output; it can be made more efficient by adjusting the field current for the generator.
Wind Turbine Power Curve Key Takeaways
Understanding and accurately measuring the peak performance of a wind turbine is essential for selecting, operating, and maintaining efficient wind energy systems. Power curves, generator output data, and air density calculations offer valuable insights into how a turbine will perform under varying environmental conditions. These measurements are not only critical for buyers making informed decisions, but also for engineers optimizing turbine placement and maintenance strategies. In real-world applications, this data supports more reliable energy production forecasts, aids in reducing downtime, and ensures that wind energy systems are both cost-effective and sustainable.