Phase Difference
When we have two sine waves with the same frequency, the duration of one cycle is the same for both. Nonetheless, irrespective of their peak values, there are two possibilities:
- 1. The two waveforms reach their maximum values (and accordingly their minimum values) at the same instant. In this case, they are synchronized or in phase with each other.
- 2. It is possible that the two waveforms do not have their maximum (and minimum) values occurring exactly at the same time. In such a case they are said to be out of phase with each other.
In phase: When two cyclic waveforms of the same shape and frequency have their pairwise maximum and minimum points occurring at the exact same time.
Out of phase: Fact of having a finite time difference between the instances that two waveforms of the same shape and frequency reach their maximum or minimum values. This can be extended for logic signals by comparing their rising or falling edges timing.
Leading and Lagging Phase Angle
When two waveforms are out of phase, then the way to express the time difference between the two is by stating the angle difference for one cycle, i.e., the angle value of the first waveform when the other one has a zero value. This is shown in Figure 1, where there is a phase difference of 30° between the waveforms A and B.
In conjunction with the phase difference are two other terms: leading and lagging.
When the waveform A is ahead of B (i.e., when it reaches its maximum value before B reaches its maximum value), it is said to be leading waveform B. At the same time, B is behind (following) A, and it is said to be lagging A.
Note that when A is leading B, it also reaches its minimum value and zero value before B reaches those values. The amount of leading or lagging is expressed by the phase angle, which is the phase difference between the two waveforms.
Note that the phase angle must always be less than 180°. It is not usual to say, for instance, that E leads C by 270°, as shown in Figure 2, by comparing points M and N (the minimum peak values of them); instead, we say C leads E by 90°.
In AC electricity, more often the 180° range for phase angle is expressed between −90° and +90°.
Leading: Opposite of lagging, implying that a cyclic waveform reaches its maximum (minimum) before another waveform of the same pattern and same frequency. Most commonly employed in AC electricity (see also lagging).
Lagging: Implying that a cyclic waveform reaches its maximum (minimum) after another cyclic waveform of the same frequency. More commonly used in AC circuits to indicate the timing relationship of current with respect to voltage.
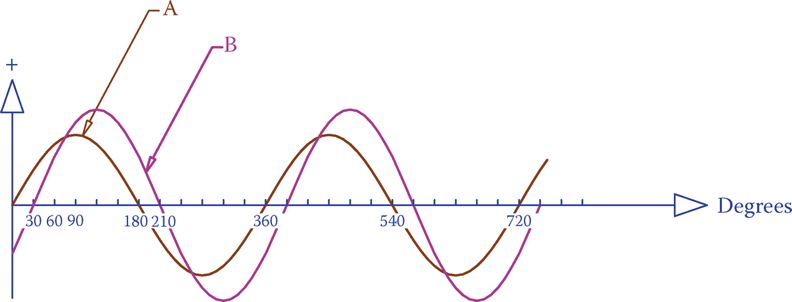
Figure 1 Definition of the phase difference.

Figure 2 Definition of leading and lagging.
Lagging and Leading Phase Angle Example 1
In Figure 3, determine if the waveform A is leading B or lagging B and by how many degrees.
Solution
In this example, A and B have all their zero values at the same time (points M and N); only, when A is increasing (to get to its maximum value), B is decreasing (to reach its minimum value).
In this particular case, A and B have 180° phase difference. It is possible to say either A is leading B or B is leading A. (Note the fact that A reaches its maximum value before B is immaterial because if the waveforms are drawn from another point, such as N, then B reaches its maximum before A.)
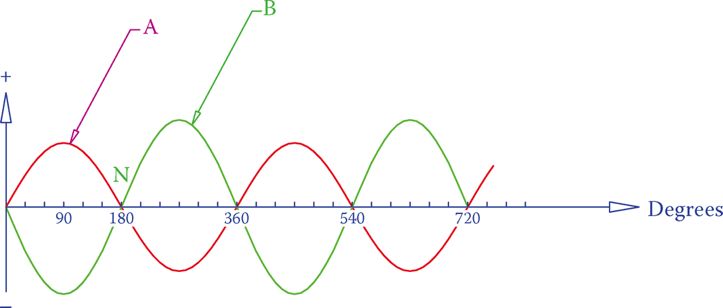
Figure 3 Waveforms A and B in Example 1.
Phase Difference between Voltage and Current in AC Circuits
Resistive Circuit: When the load in an AC circuit consists of only resistors, then the current at each instant of time is proportional to the voltage. This implies that, in changing through its sinusoidal waveform, when a voltage is zero, the current is zero, too; and when the voltage is at its positive or negative peak, the current is at its positive or negative peak, respectively. In this sense, we can say there is no phase difference between the voltage and the current. This is not the case, however, when the load is inductive or capacitive.
Inductive Circuit: As shown in Figure 3 a, for an inductor in an AC circuit the current reaches its maximum (minimum) with a delay after the voltage has reached its maximum (minimum) and this delay is 90°. In other words, the current is lagging the voltage by 90°.
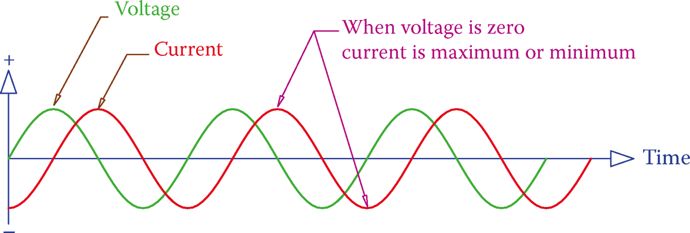
Figure 3a Current in an inductor connected to an AC source with a sinusoidal waveform.
Capacitive Circuit: By the same token, and as shown in Figure 3b, for a capacitor in an AC circuit the current leads the voltage by 90°. That is, for a capacitor the case is in the opposite way of that for an inductor.

Figure 3b Current due to a capacitor in a sinusoidal wave AC circuit.
For better clarity, the three cases for the three types of loads are depicted in Figure 4.
In an AC circuit
- • For a resistive load, there is no phase difference between current and voltage.
- • For an inductive load, the voltage leads the current by 90° (current lags voltage).
- • For a capacitive load, the current leads the voltage by 90° (voltage lags current).
Understanding the preceding concept is quite important in AC circuits. To quickly remember the correct state, the two words ICE and ELI can be helpful. Here E is used for electromotive force, which is the voltage, and I stands for current. The two words help to remember that for a C component (capacitor) in the circuit I is before E (current leads) and for an L (inductor), E is before I (voltage leads).
When dissimilar components (say resistor and capacitor together) are used in a circuit the phase angle is not 90° and can be any angle between −90° and +90°.
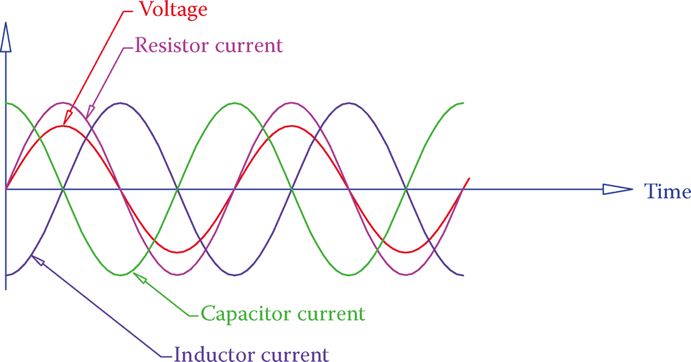
Figure 4 Phase relationships between current and voltage for the three types of loads in AC.
Use of Vectors to Show the Phase Difference
The phase difference as described before is very important in AC circuits, but it becomes tedious if two sinusoidal waveforms must be drawn in order to show their phase difference, especially if we are not always dealing with the simple case of 90° phase difference.
A simpler way of showing the phase difference between two waveforms with the same frequency is through representing each waveform by a vector. The length of this vector denotes the peak value of the waveform (employing a convenient scale), and its angle is decided by selecting an arbitrary direction (usually horizontal) for a reference waveform.
For example, a horizontal (on the paper) vector of 6 in (15 cm) length can be drawn for a 120 V sinusoidal voltage. Then, a horizontal vector of 3 in (7.5 cm) can represent another AC voltage that is 60 V and is in phase with the former, and a 2 in (5 cm) vertical vector can represent an AC current value of 2.5 A, which is leading the reference voltage by 90°.
Note the fact that it is not necessary to use the same scale for two different entities (here voltage and current). Otherwise, one or more vectors become so small in size (compared to the others) that their values cannot be seen or read. However, similar entities must have the same scale.
Figure 5 illustrates the above-mentioned voltage and current waveforms and other values by vectors. Because the AC waveforms with different frequencies cannot be mixed together, it is always understood that the waveforms shown together on a graph have the same frequency.
The positive sense of direction to determine leading and lagging is counterclockwise (CCW). Thus, if a vector V1 must be rotated counterclockwise to coincide with a vector V2, it lags V2. For instance, in Figure 5 the 2.5 A vector leads the 60 V vector, but the 3.5 A vector lags it.
Vector representation of cyclic values is both very convenient and easy. It clearly shows the phase difference between the two entities. In Figure 5 the angle of the 3.5 A vector with the reference vector is −30°. The minus sign is understood from the fact that this vector is below the reference line. Hence, its phase angle with the reference vector is 30° lagging.

Figure 5 Representation of waveforms and phase relationships by vectors.
Phase Relationships in AC Circuits Key Takeaways
In conclusion, understanding phase relationships in AC circuits is crucial for numerous practical applications, including power distribution, signal processing, and electrical system design. The concepts of phase difference, leading and lagging waveforms, and voltage-current phase shifts in resistive, inductive, and capacitive circuits play a vital role in optimizing circuit performance. Engineers and technicians rely on these principles to ensure efficient power transmission, minimize energy losses, and design stable electrical systems. Additionally, vector representation simplifies phase analysis, making it easier to visualize and calculate phase differences in complex circuits.