The article provides an overview of harmonics in power system, explaining their origin, characteristics, and how they can be analyzed using Fourier series. It also introduces the concept of harmonic distortion and sequence components in three-phase systems, highlighting their potential impact on power equipment.
Ideally, all voltages and currents in the power system should be single-frequency sinusoids (60 Hz in North America). The actual power system, however, contains voltage or current components, called harmonics, whose frequencies are integral multiples of the power system frequency. The second harmonic for a 60 Hz system is 120 Hz, the third harmonic is 180 Hz, etc. Typically, only odd harmonics are present in the power system.
Figure 1 shows one cycle of a sinusoid with a peak amplitude of 1.00 (labeled as the fundamental). The fundamental is also known as the first harmonic. The other two waveforms shown in the figure are the third harmonic, with a peak of 0.5, and the fifth harmonic, with a peak of 0.2. Note that the third harmonic completes three cycles during the one cycle of the fundamental, and the fifth harmonic completes five cycles. We could write expressions for each of the harmonics shown in Figure 1:
$\begin{align} & \begin{matrix} {{V}_{1}}=1.0\sin \left( \omega t \right) & {} & {} \\\end{matrix} \\ & \begin{matrix} {{V}_{3}}=0.5\sin \left( \omega 3t \right) & {} & \left( 1 \right) \\\end{matrix} \\ & \begin{matrix} {{V}_{5}}=\sin \left( \omega 5t \right) & {} & {} \\\end{matrix} \\\end{align}$
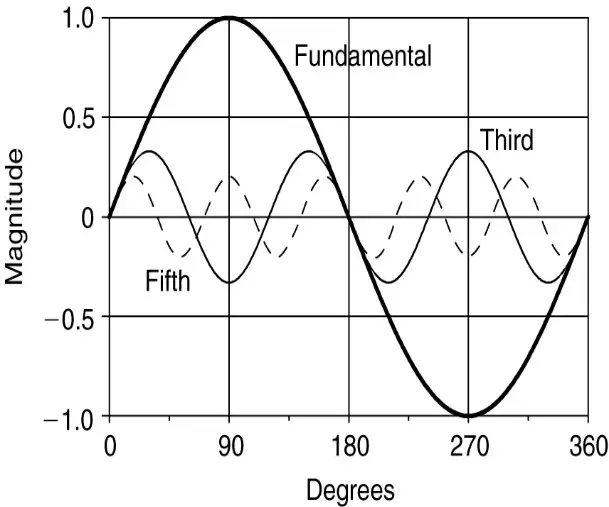
Figure 1: Fundamental, third, and fifth harmonics.
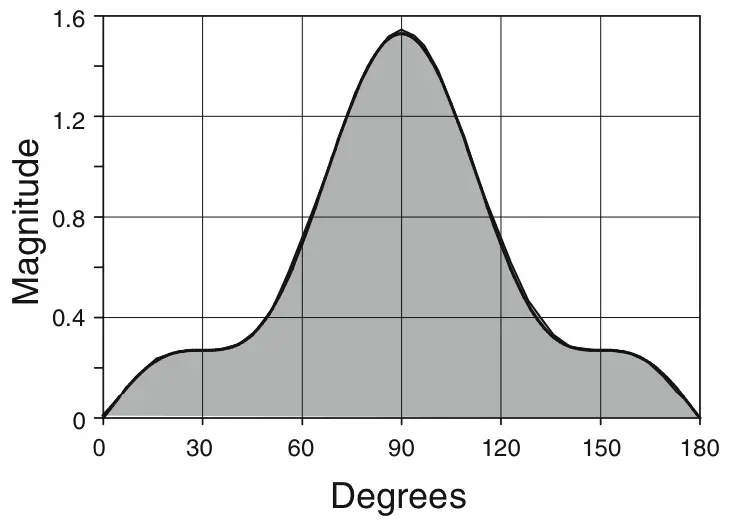
Figure 2: Pulse wave formed from the three harmonics
The three components given in equation 1 could be combined to create an infinite number of waveforms by varying the phase angles of the three components and adding or subtracting them.
As an example, suppose V3 is subtracted from the sum of V1 and V5. Figure 2 shows one half-cycle of the resulting waveform. Note that this waveform is beginning to look like a pulse. Of course, we normally would be faced with a waveform for which we would like to know the harmonic content. The question, then, is how to find the harmonic components given a waveform that repeats itself every cycle.
Fortunately, the mathematician Fourier showed that it is possible to represent any periodic waveform (i.e., one in which each cycle is the same as any other cycle) by a series of harmonic components. Thus, any periodic current or voltage in the power system can be represented by a Fourier series. Furthermore, he showed that the series can be found, assuming the waveform can be expressed as a mathematical function. We will not go into the mathematics behind the solution of Fourier series here; however, we can use the results.
As an example, a square wave of amplitude 1.0 could be represented by the following series:
\[\begin{matrix} {{V}_{square}}=\sum\limits_{n=1}^{\infty }{\frac{1}{2n-1}sin\left[ \left( 2n-1 \right)\omega t \right]} & {} & \left( 2 \right) \\\end{matrix}\]
Note that only odd harmonics are included in the series given by equation 2, because (2n — 1) will always be an odd number. Expanding the first five terms of equation 2 yields
$\begin{matrix} {{V}_{Square}}=\sin \left( \omega t \right)+\frac{1}{3}\sin \left( 3\omega t \right)+\frac{1}{5}\sin \left( 5\omega t \right)+\frac{1}{7}\sin \left( 7\omega t \right)+\frac{1}{9}\sin \left( 9\omega t \right) & {} & \left( 3 \right) \\\end{matrix}$
Figure 3 shows a waveform that was constructed from equation 3. The waveform is already beginning to resemble a square wave even with the limited number of terms. Harmonics have a number of effects on the power system as will be seen later, but for now, we would like to have some way to indicate how large the harmonic content of a waveform is. One way to do that is with the total harmonic distortion (THD). The total harmonic distortion can be defined in two different ways. The first definition, given by equation 4, shows the THD as a percentage of the fundamental component, designated as THDF. This is the IEEE definition of THD and is used widely in the United States:
\[\begin{matrix} TH{{D}_{F}}=\frac{\sqrt{\sum\limits_{h=2}^{\infty }{V_{h,rms}^{2}}}}{{{V}_{1,rms}}}\times 100 & {} & \left( 4 \right) \\\end{matrix}\]
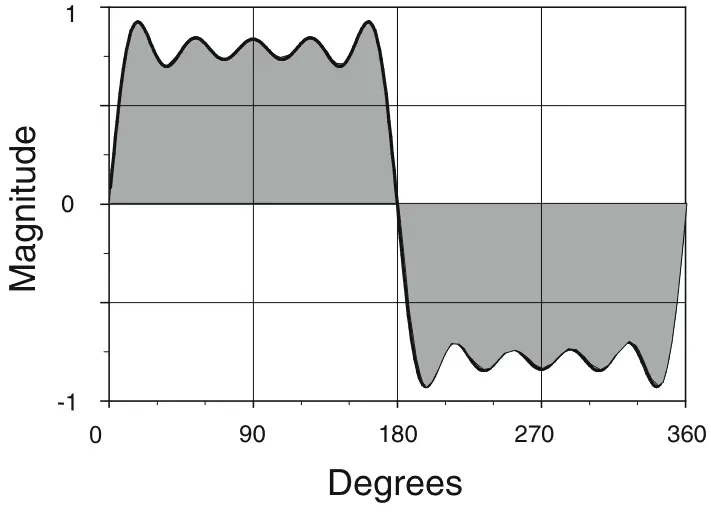
Figure 3: Approximation to a square wave using the first five terms of the Fourier series.
Where V1,rms is the rms of the fundamental component and Vh,rms is the amplitude of the harmonic component of order h (i.e., the hth harmonic). (Note: equations 4 to 9 apply to either current or voltage.) For a waveform composed of harmonics, we can calculate the rms of the total waveform from the rms values of all the harmonics, including the fundamental:
\[\begin{matrix} {{V}_{rms}}=\sqrt{\sum\limits_{h=1}^{\infty }{V_{h,rms}^{2}}} & {} & \left( 5 \right) \\\end{matrix}\]
Noting that the series in equation 5 has only one more term than the series in the numerator of equation 4 (namely, the fundamental rms), we can also find the total rms in terms of the percent THDF.
$\begin{matrix} {{V}_{rms}}={{V}_{1,rms}}\sqrt{1+{{\left( \frac{TH{{D}_{F}}}{100%} \right)}^{2}}} & {} & \left( 6 \right) \\\end{matrix}$
Some have suggested, however, that equation 4 overstates the harmonic problem and that THD should be calculated as a percentage of the rms, yielding a somewhat lower value, designated as THDR. This definition is used by the Canadian Standards Association and the IEC:
\[\begin{matrix} TH{{D}_{R}}=\frac{\sqrt{\sum\limits_{h=2}^{\infty }{V_{h.rms}^{2}}}}{{{V}_{rms}}}\times 100 & {} & \left( 7 \right) \\\end{matrix}\]
The value for THDR can be obtained from THDF by multiplying by V1,rms, and dividing by Vrms:
\[\begin{matrix} TH{{D}_{R}}=TH{{D}_{F}}\times \left( \frac{{{V}_{1,rms}}}{{{V}_{rms}}} \right) & {} & \left( 8 \right) \\\end{matrix}\]
Substituting equation 6 into equation 8 yields another expression for THDR in terms of THDF:
\[\begin{matrix} TH{{D}_{R}}=\frac{TH{{D}_{F}}}{\sqrt{1+{{\left( \frac{TH{{D}_{F}}}{100%} \right)}^{2}}}} & {} & \left( 9 \right) \\\end{matrix}\]
Where both THDR and $TH{{D}_{f}}$ are percents. Clearly, the definition of THDR given by equations 7 and 9 will always result in a THD of less than 100%. THD is very important because the IEEE Standard 519 specifies maximum values of THD for the utility voltage and the customer’s current.
Harmonic Sequence
In a three-phase system, we normally assume an ABC sequence for the phases, meaning that if we watched the rotation of the phasors, phase A would come by, then phase B, and finally phase C.
Figure 4(a) shows an ABC sequence of phasors. This sequence is called the positive sequence.
Figure 4(b) shows a set of phasors that have their sequence reversed. Phase A is followed by phase C and then phase B. Such a sequence is given the name negative sequence.
Finally, in Figure 4(c), there is a set of three phasors that are identical in all three phases; i.e., there is no phase angle between them. This set of phasors is called the zero sequence.
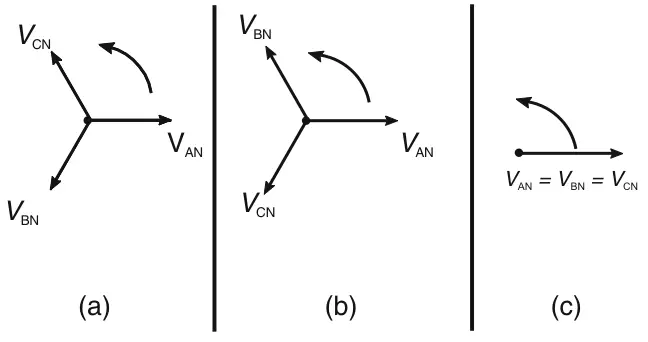
Figure 4: (a) Positive, (b) negative, and (c) zero sequences.
Negative- and zero-sequence currents and voltages can have dramatically different effects on power equipment as compared to the positive sequence. It turns out that harmonics have different sequences, depending on their order (the number of the harmonic).
Figure 5 shows how different harmonics have different sequences. Figures 5 (a), (b), and (c) show the fundamental component of a three-phase set of waveforms and their second harmonics. Note that the phase angle relationship has been chosen such that the second harmonic and the fundamental both cross through zero in the ascending direction at the same time. Now consider the sequences of these waveforms.
The peaks of the fundamental components have been labeled as A1, B1, and C1. By examining their relative position in Figures 5(a), (b), and (c), we see that the fundamental component has an ABC or positive sequence.
Now, look at the first peaks of the second harmonics, labeled a2, b2, and c2. We note that the c2 peak is located between the a2 and b2 peaks. Thus, the second harmonic has an ACB, or negative, sequence. Finally, consider Figures 5(d), (e), and (f). These figures again show the same fundamental components but show the third harmonic instead of the second.
Again, the phase angle was chosen so that the fundamental and third harmonics increased through zero together. The peaks of the third harmonics are labeled a3, b3, and c3, and it can clearly be seen that all three peaks occur at the same time. Thus, there is no order to the third harmonic, so it is a zero- sequence component. If we continued, we would find that the fourth harmonic has a positive sequence, the fifth a negative sequence, and the sixth a zero sequence, and so on.

Figure 5: First, second, and third harmonics.
Note that all harmonics whose order is 3n, where n is any positive integer, will have a zero sequence. These harmonics are referred to as the triplen harmonics. Triplen harmonics can cause serious problems in three-phase systems, as we will see later in this chapter. First, however, let’s consider what causes harmonics in the power system.
Harmonics in Power System Key Takeaways
Understanding harmonics in power system is critical for maintaining system efficiency, stability, and safety. Harmonics, originating from non-linear loads and distorted waveforms, can lead to overheating, equipment malfunction, and interference with communication signals if not properly managed. The application of Fourier series enables engineers to analyze complex periodic waveforms and quantify their harmonic content through metrics like Total Harmonic Distortion (THD). Moreover, recognizing the sequence components—positive, negative, and zero—associated with each harmonic order is essential for predicting how harmonics will interact with three-phase systems. These concepts are foundational for designing effective filters, establishing standards like IEEE 519, and ensuring that both utility providers and consumers maintain power quality. In real-world applications, such as industrial automation, renewable energy systems, and electric vehicle charging stations, managing harmonics is key to ensuring reliable and efficient operation.