The article explains the basic operation and components of an oscilloscope, focusing on how it displays and measures electrical waveforms. It also covers key features like calibration, probe use, voltage and frequency measurements, and modern digital capabilities.
The oscilloscope is a test instrument that permits observation of waveform patterns representing voltages in an electronic circuit, Figure 1. It is a priceless service instrument. At first, the oscilloscope can appear to be a very complex instrument, but after a little familiarization, you will see that it is really very easy to use.
All oscilloscopes have similar features, but there is some degree of variation among different models. The basic principles and operating controls covered in this unit will be the same for most oscilloscopes.

Figure 1. Typical oscilloscope. (Knight Electronics)
Oscilloscopes display waveforms on a cathode-ray tube (CRT). An electron beam is emitted from the cathode gun in the CRT tube. The beam travels between two sets of beam deflector plates. One deflector plate is for horizontal deflection of the electron beam, and the other plate is for vertical deflection.
The electron beam strikes the inside surface of the CRT display. This surface is coated with a luminous material such as phosphorus. When the luminous display screen is struck by the electron beam, it produces light. The light leaves a pattern on the display screen that represents the amplitude (height) and time period (width) of the electrical wave being observed and studied. See Figure 2.
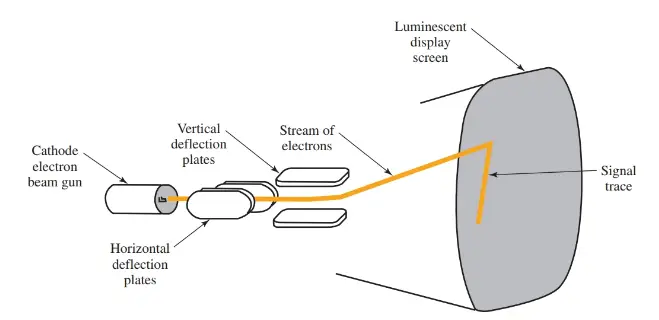
Figure 2. A cathode-ray tube (CRT) is used in an oscilloscope. It consists of a cathode that emits a beam of electrons that strike a luminescent display screen. The vertical deflection plates and horizontal deflection plates control where the beam hits the display screen.
If an AC voltage is applied to the scope, the vertical deflection circuit controls the vertical deflection plate magnetic intensity. The vertical plate causes the beam of electrons to produce a wave of light on the display screen that is similar to the amplitude of the input voltage. This wave represents the instantaneous voltages during the cycles of the ac input.
The horizontal sweep oscillator can be adjusted through a wide range of frequencies until it matches the frequency of the input voltage. Once the horizontal sweep is matched appropriately to the input voltage frequency, a series of light waves, with a width that graphically represents the frequency of the input voltage, is displayed on the CRT screen. Assume that the horizontal sweep is adjusted at 60 Hz. It is then producing 60 straight lines per second across the face of the CRT. The time for one sweep would be 1/60th of a second.
Now, a 60 Hz ac voltage is applied to the vertical input terminals. This wave starts at zero, rises to maxi- mum positive, and returns to zero. It then decreases to maximum negative and returns to zero. All of this occurs during one cycle. The period of this cycle is 1/60th of a second. Therefore, the horizontal sweep and the input signal voltage are synchronized. One wave appears on the screen.
If the horizontal sweep were set at 120 Hz, which is twice as fast as the 60 Hz input signal, then two complete waves would appear on the screen. The horizontal frequency can be adjusted so that the waveforms appear stationary (not moving).
The display screen of a typical oscilloscope is a grid pattern. The grid pattern is used to aid the observer in measuring or comparing the wave pattern. Look at Figure 3.
A sine wave pattern is displayed on the grid. Using the grid and the setting of the vertical range selector switch, a voltage measurement can be made. The selector switch is used in conjunction with the grid to determine the voltage amplitude of the waveform. The grid is also used in conjunction with the time sweep set- ting of the scope.
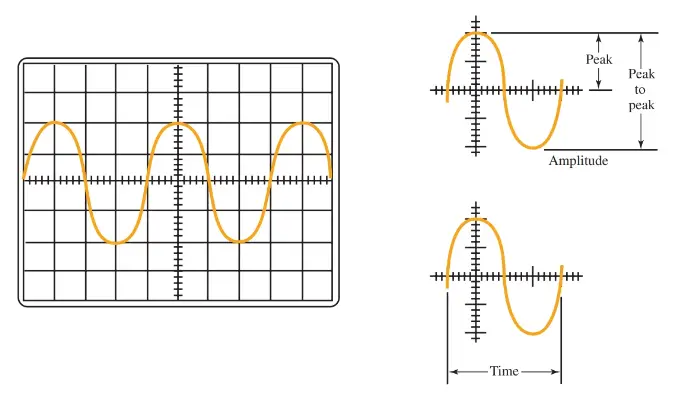
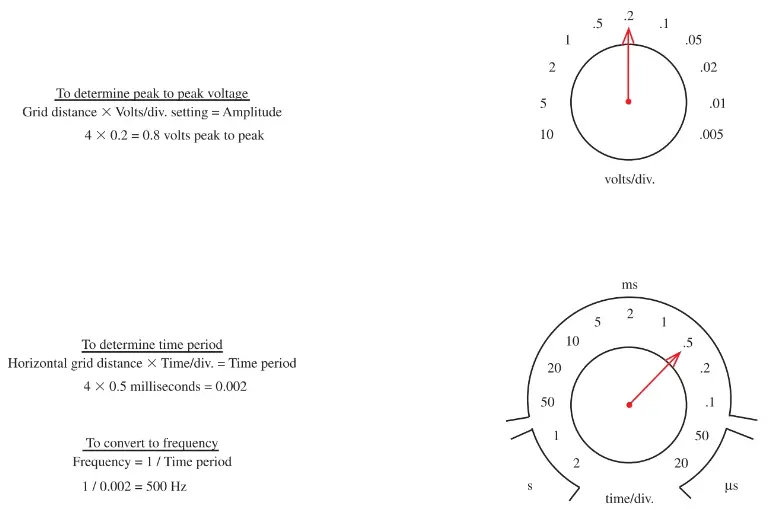
Figure 3. The voltage and frequency of a waveform can be determined using the CRT grid and the settings indicated on the volts/div. and the time/div. selector switches.
Voltage Measurement
To measure the voltage of the wave displayed on the screen simply use the grid as you would use a common ruler. If the voltage selector switch (usually marked volts/div. or volts/cm.) is set on 0.2, then the distance across each grid square from top to bottom is equal to 0.2 volts.
If the volts/div. is set on 0.005, then the same grid space is equal to five millivolts. The small lines running up and down the center of the display are used to assist in making accurate measurements. The small lines divide each grid square into five equal parts. Look again at Figure 3.
The sine wave pattern covers a distance of four grid spaces from top to bottom. If the volts/div. selector switch is set on 0.2, then the voltage amplitude of the waveform is equal to 0.8 volts peak to peak.
A probe is used to connect the oscilloscope to the test circuit. A typical oscilloscope probe is shown in Figure 4. It is constructed of a shielded cable with a connector on one end and the probe tip on the other.
Shielded cable is used to prevent interference from stray electromagnetic fields. Most probes are also equipped with a switch for amplifying the reading being taken. The two switch settings are usually marked X1 and X10, which means “times” one and “times” ten.
When the slide switch on the probe is set at X10, the voltage reading on the grid should be multiplied by ten. When the probe is equipped with a multiplier such as times ten, then the probe is referred to as an attenuator probe. The times ten reading is due to an internal resistor that is connected in series with the probe lead.
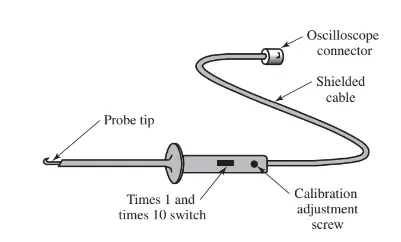
Figure 4. Typical oscilloscope probe.
Time Period and Frequency
The time period for the wave can be determined in a similar fashion to that used for finding the voltage. The time period of the sweep is set using the time/div. selector switch. The time period selector switch is marked in whole seconds, milliseconds, and microseconds.
If the time/div. selector switch is set at 0.1 ms, then each grid space is equal to 0.1 millisecond. If the time/div. selector switch is set to 2 s, then each grid spacing is equal to two whole seconds. Look again at Figure 3. The selector switch time/div. is set at 0.5 milliseconds. The sine wave pattern covers four grid spaces to complete one full cycle. The time period is equal to 0.002 seconds.
To find the frequency of the wave, we divide one by the time period. In the example in Figure 3, the frequency is equal to 500 Hz (1 ÷ 0.002 = 500).
Calibration
To ensure accurate readings are taken from the oscilloscope, it should be calibrated before use. The exact method of calibration will vary from scope to scope. The calibration technique described here is generic in nature and may not exactly match the scope you will be using. Always read the owner’s manual to learn how to properly calibrate your oscilloscope.
A square wave pattern is generally placed on screen to calibrate the amplitude and time period. The square wave can also be used to correct any distortion caused by the oscilloscope’s probes.
First locate a point on the face of the scope usually marked CAL., which is the abbreviation for calibration. This point is where you will connect the tip of the probe. The voltage, time period, and wave shape is provided by the scope as the perfect reference for the calibration operation. A square wave will appear on the screen. From this point the appropriate adjustments can be made to make the wave on screen match the expected reference wave. Most scopes use 0.5 volts at 1000 Hz square wave as the reference.
See Figure 5. The three examples of the square wave are shown. The rounded-off or sharp-peaked corners of the square wave pattern indicate that the probe needs adjustment.
There is usually a small screw head in the side of the probe or at the connector. Adjust the screw until the square wave has a nice squared-off corner appearance as indicated in frame on the left side of Figure 5.
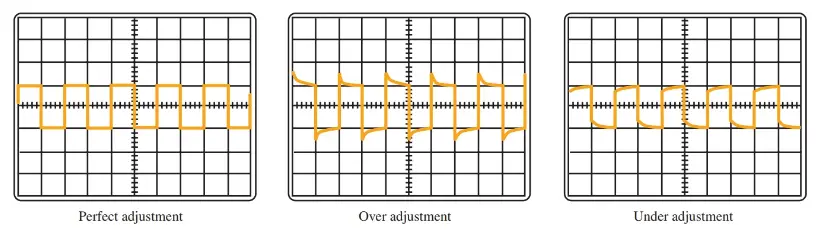
Figure 5. Typical calibration display patterns
Intensity and Focus
The focus and intensity control the appearance of the wave on the CRT screen. Focus is used to make the wave appear sharper. It eliminates any fuzzy appearance the wave may have.
The intensity controls the brightness of the light beam striking the front of the screen. The intensity should never be set to a level higher than is needed to comfortably observe the wave pattern.
If the setting of the intensity is too high and the scope is left unattended, the display screen can be permanently damaged. Reduce the intensity when you are not using the scope.
Before the scope is turned on, and while it is warming up, the intensity should be set to its lowest setting. After the warm-up period (check owner’s manual for recommended warm-up time), it is safe to adjust the intensity level.
Additional Features
Today, many oscilloscopes in use are completely digital and incorporate a computer as part of the scope system. The wave pattern can be observed, as well as saved to a battery-powered computer memory. Many scopes are also equipped to print a paper copy of the wave pattern.
Some scopes used today are a combination VOM and oscilloscope with a display screen. The display screen not only displays the wave pattern but also digitally displays the frequency and voltage values.
Oscilloscopes can also be connected directly to a personal computer. This is referred to as data acquisition and transfer. This application usually requires an expansion card for the computer, software to run the program, and an interface cable to connect the oscilloscope to the computer. These peripherals are often provided with the scope.
A personal computer used in this way will display the wave patterns, voltage, and frequency of the waveform. The information can be downloaded directly into documents for use in reports or training manuals.
Oscilloscope Key Takeaways
Understanding the basic operation, features, and usage of an oscilloscope is essential for anyone working with electronic circuits or systems. Oscilloscopes are not just laboratory tools—they play a vital role in real-world applications such as diagnosing faults in electronic equipment, analyzing signals in communication systems, and validating circuit designs in engineering development. Their ability to accurately display voltage and frequency waveforms, along with modern digital enhancements and data transfer capabilities, makes them indispensable for troubleshooting, design verification, and educational training.