The article discusses the general methodology for calculating the cost and sizing of a solar energy system based on energy load, local insolation, and efficiency factors. It also compares the costs and performance of silicon and GaAs-based solar systems, considering capital investment, system lifetime, and energy output.
A general method of calculation will start from the load energy requirements; determine the local insolation level and the worst month insolation and from this determine the sizing of the storage capacity. From this follows the array power and area, the battery capacity, and eventually the voltage regulator size respectively, and the inverter/converter size.
The insolation in kilowatt-hour per square meters per day is known for most areas of the Earth. The average value of kilowatt-hour per square meters over a day is roughly one half the maximum value (around 1 kW/m2) times the hours of insolation. This value has to be averaged again to obtain the yearly average of insolation. Typical mean values from winter to summer in northern regions of the U.S. vary from 3 to 6 kWh/m2 day. Detailed values exist for all of the U.S. They vary from 2.3 in northern regions to 6.5 in desert regions like Arizona.
In a detailed analysis, the required array power is calculated by dividing the energy load value, L (kilowatt hours per day), by the array-sizing factor, S (kilowatt hours per square meters day), and a number of dimensionless factors accounting for the converter, battery, degradation, etc. For example, L = 2.8 kWh/day and S is 3.7 kWh/m2day the ratio L/S would give the required number of square meters, here, 0.756 m2. Due to loss factors, this value is generally multiplied by 1.The value of s = 3.7 kWh/m2day means that lm2 delivers 3.7 kWh/day to the solar cells. The actual output of the solar cells depends on their efficiency.
A normal panel with 10% conversion efficiency will thus deliver only 0.37 kWh/ day. A division of the L/S value (times 1.3) by the panel efficiency and the factors taking care of temperature degradation results in a value
\[A=\frac{{L}/{S}\;}{\eta \left[ 1+{{P}_{tc}}\left( {{T}_{op}}-{{28}^{o}}C \right) \right]}\]
Where Ptc is the temperature degrading factor, and Top is the operating temperature. With an efficiency of 10% of the solar cells and a temperature degrading factor of Ptc = 0.005 and a top temperature of 55°C, the actual area for a value of L/S = 0.756 m2 (or 756 Wp for a normal insolation of 1 kWp/m2 which has to be set at 1063 W in most cases) will result in an area of: A = 12 to 13 m2 instead of 10 m2 for the average daily energy requirement of 2.8 kWh.
In the following, we will compare a silicon flat-plate solar array and an III-V-compound (GaAsAl/GaAs) solar cell system with concentrator and cogeneration.
Basic Systems Assumptions
- 100 kWe array for day use
- 100 kWe array of batteries for night use
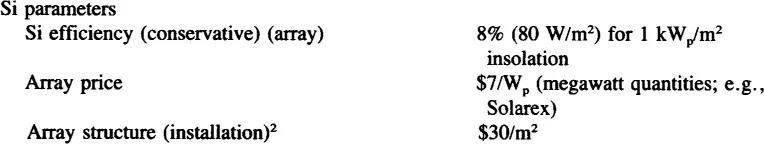

Silicon System Costs

GaAs-System Costs


Capital Investment Requirements
System Lifetime: 20 years


Capital Recovery Loan
Assume: 20-year payback of principal and interest
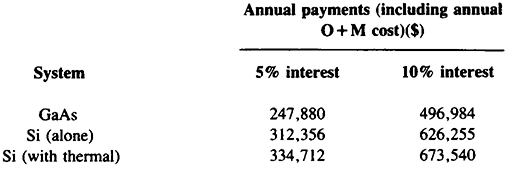
Annual Energy Costs
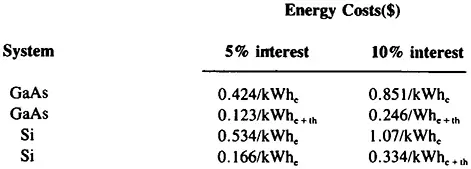
Annual Energy Utilized
Electric: 584,000 kWhe
Thermal: 1,430,800 kWhth
Total: 2,014,800 kWhe+th
Solar Energy System Cost Key Takeaways
Understanding the cost estimation, system sizing, and performance comparison of different solar technologies is crucial for designing efficient and sustainable solar energy systems. These factors play a vital role in real-world applications such as residential, commercial, and industrial energy planning, where accurate assessment ensures optimal investment, reliable energy supply, and long-term environmental and economic benefits.