This article covers the concepts of frequency response and Bode plots in amplifiers, focusing on bandwidth, gain variations, and the impact of capacitance. It also explores how to interpret amplifier behavior across a wide range of frequencies using logarithmic scales.
Frequency Response of Amplifiers
The gain of an amplifier does not remain constant over all of the frequencies that are applied to its input. This means that the power available at the output of the amplifier will change with the applied input frequency. This would make the amplifier unacceptable in applications that require the output to remain constant over a wide range of input frequencies, such as those in a high-quality audio amplifier. The range of frequencies over which the gain of the amplifier remains relatively constant is termed the bandwidth. The values of the current ($i$), voltage ($V$), and power ($P$) gain ($A$) of an amplifier are called its midbands $A_{i(midband)}$, $A_{V(midband)}$, and $A_{P(midband)}$, respectively. The frequency at which the output power becomes half of the input power is designated as a 3 dB-down point, since:
$$\text{Power gain/loss (dB)} = 10 \log_{10} \left( \frac{P_{out}}{P_{in}} \right) = 10 \log_{10}\left(\frac{1}{2}\right) = -3.01 \, \text{dB} $$
Amplifiers generally have two 3 dB-down points: one that occurs at a low frequency and another at a high frequency. The range of frequencies between these two points is the bandwidth. The lower 3 dB-down point is called the low cutoff frequency and the high 3 dB-down point is called the high cutoff frequency. For proper operation, the frequency of the input applied to the amplifier should stay within the upper and lower 3 dB-down points. The bandwidth, low and high cutoff frequencies are shown in the figure below.
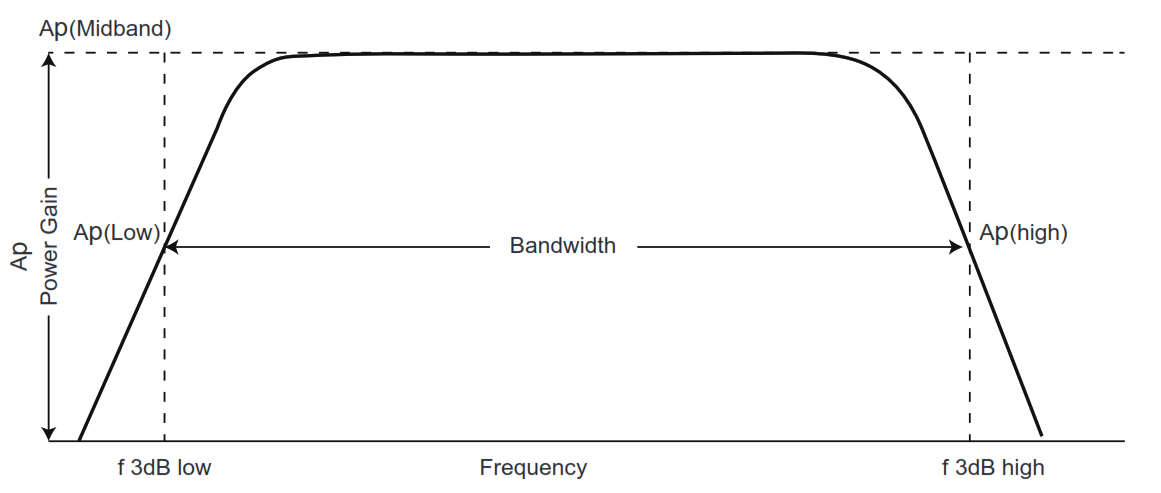
Figure 1. Frequency response curve.
The bandwidth or BW of an amplifier can be calculated using the following formula:
$$BW = f_{3dB-down \, (High)} – f_{3dB-down \, (Low)} $$
Example 1
What is the bandwidth of an amplifier which has $f_{3dB-down , (Low)} = 10 , \text{kHz}$ and $f_{3dB-down , (High)} = 50 , \text{kHz}$?
Solution
$$BW = 50 – 10 \, \text{kHz} = 40 \, \text{kHz}$$
Displaying the range for frequencies ranging from a few Hz to several thousand Hz in the case of an audio amplifier requires the use of the logarithmic scale, rather than the linear scale. The reason is that a linear scale which counts off equal values of frequency, starting, say, at 20 Hz, would need to have as its smallest unit 20 Hz. On the same linear frequency scale, if one were to denote 20,000 Hz, that would require $20,000/20 = 1000$ equally spaced divisions of 20 Hz. Such a plot would be cumbersome to sketch. Using a logarithmic or log scale makes it possible to display a wide range of frequencies, as shown in the following table:
| Linear scale | Log scale |
| 1 | $\log(1) = 0$ |
| 10 | $\log(10) = 1$ |
| 100 | $\log(100) = 2$ |
| 1000 | $\log(1000) = 3$ |
| 10,000 | $\log(10,000) = 4$ |
| 100,000 | $\log(100,000) = 5$ |
As can be seen by using the log scale, even very high frequencies can be conveniently sketched. On the log scale, each time the frequency changes by a factor of 10, it is called a decade. So if the frequency changes from 100 to 10 Hz, this would be a decade down; or if it changes from 100 to 1000 Hz, that would be a decade up. Amplifiers may have a specification such as “roll-off rate” in terms of dB/decade. For example, an amplifier with a roll-off rate of 20 dB/decade beyond the low (20 Hz) and upper cutoff (20 kHz) indicates that if the frequency becomes either 2 or 200,000 Hz, then the gain will drop by an additional 20 dB.
Bode Plots of Amplifiers
Instead of simply plotting the gain vs. frequency, it is often convenient to plot the gain (in dB) as compared to the midband gain vs. frequency, as is done in a Bode plot. By doing so, the range of midband frequencies over which the $A_{P} = A_{P(midband)}$ is plotted on the horizontal axis, since:
$$\text{Power loss (dB) with ref. to midband gain} = 10 \log_{10} \left( \frac{A_{P}}{A_{P(midband)}} \right) = 0 \, \text{dB} $$
As we saw earlier, the gain of an amplifier remains constant when operated within the upper and lower cutoff frequencies (bandwidth). The gain of an amplifier, thus, stays at 0 dB for the entire range of frequencies specified between the cutoff points. Beyond the upper cutoff point, when the frequency increases (or decreases in the case of a lower cutoff point) by a factor of 10 times or a decade, the gain changes by the roll-off factor. The power gain of the amplifier, for example, may be specified to drop by 20 dB/decade beyond the midrange frequencies. This is shown in the following figure.
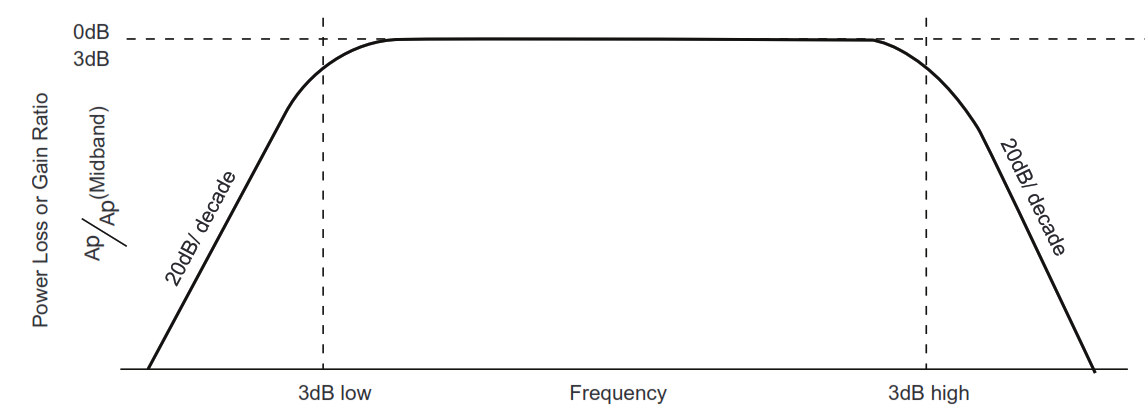
Figure 2. Bode frequency plot.
Bode plots are used extensively for plotting the frequency response of amplifiers, as it conveniently shows the power gained or lost in an amplifier as a function of the change in the input frequency.
When amplifiers are cascade-connected, the combined bandwidth of the system can be obtained by plotting the 3-dB lower and upper cutoff points of each stage. Beyond the cutoff points, for each decade change in the frequency, in general, the gain drops by a factor of 20 dB. For multistage cascade connected amplifiers that have overlapping bandwidth regions, only the portion of frequencies which is completely overlapped will function as the midband region (0-dB portion) for the overall amplifier system in the Bode plot.
As an example, consider the first stage of an amplifier system with the $f_{3dB-down , (Low)} = 1 , \text{kHz}$, and $f_{3dB-down , (High)} = 1 , \text{MHz}$, cascaded into the second stage of an amplifier with the $f_{3dB-down , (Low)} = 10 , \text{kHz}$ and $f_{3dB-down , (High)} = 100 , \text{kHz}$. The only portion where the normalized gain essentially stays at 0 dB would be in the regions that overlap completely. In this case, it would be the bandwidth specified by the second-stage amplifier.
Capacitive Effects in Frequency Response
The frequency response of a BJT amplifier depends on its internal and external capacitances of the circuit. At a low frequency, the coupling capacitances used in multistage amplifiers offer some impedance to the applied input signal, since $X_{C} = \frac{1}{2\pi fC}$. So, at low frequencies, in order to keep the value $X_{C}$ low, a large capacitor value is needed. However, at higher frequencies, $X_{C}$ is low and almost equal to $0 , \Omega$. Also, the capacitors used at high frequencies could be made smaller in value.
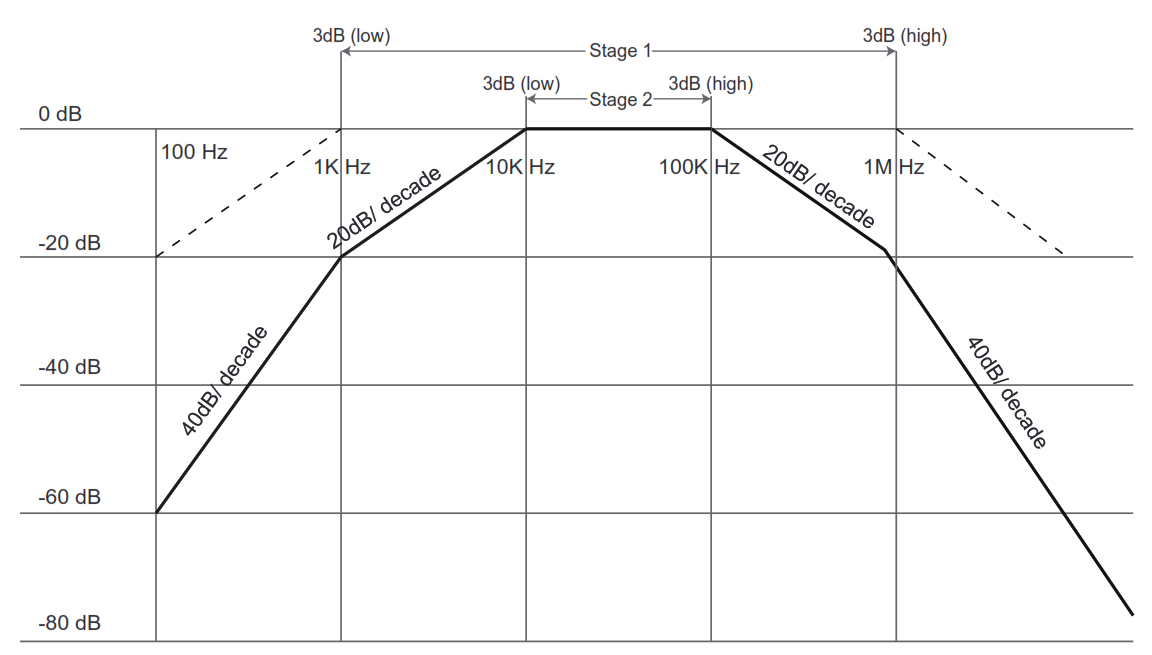
Figure 3. Frequency response of a two-stage amplifier.
The value of the emitter bypass capacitor in a BJT common-emitter configuration circuit and the frequency of the AC input together determine the extent to which the capacitor is bypassed during AC amplification. Ideally, the capacitor should completely bypass the resistor connected between the emitter and the ground, so that the operating point of the BJT does not vary at the frequency of the applied AC input.
All P–N junctions within a transistor have some measurable amount of capacitance and, thus, capacitive reactance, $X_{C}$. Since one major concern of an amplifier is its frequency response, the internal capacitance of a capacitor is an important consideration that must be taken into account. BJTs have two P–N junctions and, thus, two capacitances: one between the base and emitter denoted as $C_{BE}$; and another between the base and collector denoted as $C_{BC}$. These internal capacitances are significant enough to be taken into consideration in high-frequency amplifier applications. In many cases, this capacitance might be identified on the transistor manufacturer’s datasheet.
JFETs and MOSFETs are semiconductor devices that also have P–N junctions in their construction. The internal capacitances across these junctions must be taken into account, along with the AC input frequency for determining its response.
Review Questions
- The frequency range where an amplifier maintains consistent gain is called the _________.
- The points at which amplifier gain drops by 3 dB are known as the _________ frequencies.
- A tenfold change in frequency is referred to as a _________.
- The formula to calculate bandwidth is $BW = f_{High} – f_{Low}$, where $f_{High}$ and $f_{Low}$ are the ________ frequencies.
- A Bode plot displays gain in ________ with respect to midband gain.
- An amplifier’s gain drops by 20 dB for every tenfold increase in frequency, which is described as the _________ rate.
- A large coupling capacitor is required at _________ frequencies to minimize impedance.
- The internal capacitance between the base and collector of a BJT is denoted as _________.
- The 0 dB region in a Bode plot corresponds to the amplifier’s _________ region.
- In multistage amplifiers, the effective midband frequency range is the region that is _________ across all stages.
Answers
- bandwidth
- cutoff
- decade
- 3 dB-down
- decibels (dB)
- roll-off
- low
- $C_{BC}$
- midband
- completely overlapped
Key Takeaways
Understanding the frequency response and Bode plot characteristics of amplifiers is critical for designing systems that require consistent gain over a wide range of frequencies, such as audio amplifiers and communication systems. The knowledge of cutoff frequencies, bandwidth, and roll-off rates helps engineers ensure optimal performance in multistage and high-frequency circuits.