Learn how to draw phasor diagram, representing sinusoidal quantities with magnitude and phase angles. Master the techniques of adding phasors graphically or mathematically to analyze AC circuits effectively.
A vector is a line that, by its length and direction, represents the magnitude and angle of application of a force or velocity or other vector quantity. ‘Phasor’ is a term used to describe rotating vectors which appear in electrical calculations. Voltage and current phasors represent the RMS value of the voltage or current by their length and the angle of the phase difference between the phasor diagram and the reference plane.
What is a Phasor Diagram?
Alternating currents and voltages, and their phase relation, can be represented by means of sine waves, as in, Figures 1 (a), 2 (a) and 3 (a), but this method is inconvenient. A simpler method is to use phasors in a phasor diagram, as in Figures 1 (b), 2 (b) and 3 (b). Because the RMS values of ac are of such importance, phasor diagrams are nearly always scaled to represent the RMS values and, unless otherwise stated.

Figure 1 In-Phase Electrical Phasors

Figure 2 Lagging Electrical phasor

Figure 3 Leading Electrical Phasor
How to Draw a Phasor Diagram?
Referring to Figure A, the reference phasor is always drawn horizontally and to the right, and all phase angles must be measured from the reference phasor. When choosing the reference phasor, it is common practice to select a quantity that has the same value in all parts of the AC circuit.

Figure A Electrical Phasor Diagram
For a series circuit, the current is used as the reference phasor, because the current is common to all parts of the AC circuit.
For a parallel circuit, the voltage is used as the reference phasor, because the voltage is common to all parts of the AC circuit.
Alternating currents result when an alternating voltage is applied across a load. When the current and voltage curves pass through the zero position at the same time and increase to their maximum values in the same direction, the wave forms are in phase with each other, as shown in Figures 1 (a). The phasor diagram for the in-phase condition is shown in Figure 1 (b).
A convention has been adopted in this article to distinguish between voltage and current phasors. The voltage phasor is drawn in red and the current phasor is drawn in blue.
In some AC circuits, the current and voltage curves do not reach their zero and maximum values simultaneously and they are said to be ‘out of phase’ and the angle of lead or lag is called the ‘phase angle’ (symbol φ).
It should be noted that this symbol is used by convention to indicate an angle between two phasors and is not interchangeable with the ‘theta’ (θ) symbol used to indicate an angle of rotation. A second convention is that all phasors are assumed to rotate in an anticlockwise direction, starting at the positive x-axis.
Figure 2 (a) shows the current lagging the voltage by 60° and Figure 2 (b) shows the same condition using phasors.
Figure 3 (a) shows the current leading the voltage by 60° and Figure 3 (b) shows the same condition using phasors.
How to Add Phasors by Graphical Method
Alternating values of current or voltage cannot be added arithmetically unless they are in phase. If two AC voltages are connected in series, they might not be in phase with each other. One method of adding phasors is to draw the phasors to scale and angle, using RMS values, and then add them together using the parallelogram method, as shown in Example 1 and Figure 4.

Figure 4 Parallelogram method
Example 1
Two voltages A and B are connected in series. Voltage A is 150 V and leads the current by 45° voltage B is 100 V and lags the current by 30°. Find the total EMF and phase angle.
Since the two voltages are in series, the current is used as the reference phasor. To construct the phasor diagram, follow these steps: (Figure 4)
Step 1. Draw the current phasor horizontally to the right as the reference phasor.
Step 2. Draw the phasors for VA and VB to scale measuring the phase angles from the reference phasor using a protractor.
Step 3. Construct the phasor parallelogram.
Step 4. Draw the resultant and determine the total EMF by scale and measure the phase angle.
Total voltage = 201 V (ans A)
Phase angle Φ = 17° leading (ans B)
How to Add Phasors by Mathematical Method
The graphical method is useful for estimating the total value and often that is all the electrical worker needs. But modern calculators make the task easy and far more accurate by the use of trigonometry and many include a polar-to-rectangular converter function which you will soon see as useful (even the iPhone has an app. for this!).
The calculation can be made using several methods, but the most common method uses trigonometry in a process that converts the polar-form phasors into horizontal and vertical components that are known as the rectangular form. Phasors in phase can be directly added together, so the horizontal parts are added and so are the vertical parts. The rectangular form that results is then converted back into a polar form phasor using Pythagoras’ theorem and the arc–tan (tan−1) function. This process is used in Example 2 (a).
Some scientific calculators even have a function to convert polar to rectangular and rectangular to polar, and may even add the rectangular form, making the whole process quick and simple, as shown in Example 2 (b).
Example 2
Two voltages A and B are connected in series. Voltage A is 150 V and leads the current by 45° voltage B is 100 V and lags the current by 30°.
| (a) | Find the total EMF and phase angle by trigonometric method.
|
| (b) | Find the total EMF and phase angle using Polar to Rectangular conversion (P>R) and Rectangular to Polar conversion (R>P) functions on a suitable calculator.
|
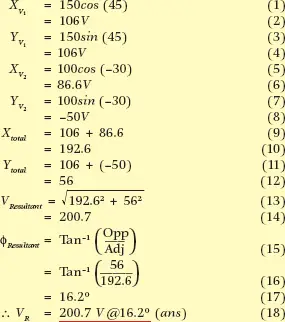
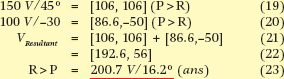
Figure 5 shows the phasor diagram with the math used to determine each. This ends up quite cluttered, so the phasor sketch is generally drawn at the top of the calculation and the math is performed under the diagram, as in Example 2.

Figure 5 Trigonometric method
Phasor Diagram in AC Circuit Key Takeaways
Phasor diagrams visually represent the magnitude and phase relationships of AC quantities such as voltage and current. Phasor diagrams help analyze and calculate various parameters in AC circuits, such as power factors, impedance, and circuit performance.
Phasor addition allows combining multiple phasors to determine the resultant phasor representing the total magnitude and phase. Phasor addition can be performed graphically or mathematically, and it helps simplify complex AC circuit analysis by simplifying calculations and visualizing the overall phasor relationships.
Phasor Diagram FAQs
What is a phasor diagram in an AC circuit?
A phasor diagram is a graphical representation of the amplitude and phase relationships between different voltage or current phasors in an AC circuit. It helps visualize the behavior of AC quantities over time.
How do you draw a phasor diagram?
To draw a phasor diagram, you represent each voltage or current phasor as a vector with its magnitude and phase angle. The vectors are then drawn on a common reference axis according to their respective angles to depict their relative positions and relationships.
What is the purpose of a phasor diagram?
The purpose of a phasor diagram is to analyze and understand the behavior of voltages and currents in an AC circuit. It helps determine phase differences, identify leading or lagging relationships, and calculate total magnitudes or resultant values through vector addition.
Can phasor diagrams be used for complex circuit analysis?
Yes, phasor diagrams are particularly useful for complex AC circuit analysis. They provide a simplified representation of the complex quantities involved, making it easier to visualize and calculate the overall behavior of voltages and currents in the circuit.
How does phasor addition work in a phasor diagram?
Phasor addition in a phasor diagram involves combining multiple phasors by aligning them tip-to-tail and connecting the starting and ending points. The resulting phasor represents the total magnitude and phase relationship of the combined quantities. This technique simplifies the mathematical calculations involved in AC circuit analysis.