The article provides an overview of the electrical power system, detailing its three major components: generation, transmission, and distribution. It discusses the transmission and sub-transmission systems, distribution system, radial system, electric energy production, transmission and distribution, electrical load characteristics, load curve, and load duration curve, offering insights into the structure, operation, and characteristics of power systems.
The electrical power system can be divided into three major components: generation (G), transmission (T), and distribution (D), as shown in Figure 1. The generating system provides the system with electric energy.
Transmission and Sub-Transmission Systems
The transmission and sub-transmission systems are meshed networks; that is, there is more than one path from one point to another. This multiple-path structure increases the reliability of the transmission system. The transmission network is a high-voltage network designed to carry power over long distances from generators to load points. The sub-transmission network is a low-voltage network whose purpose is to transport power over shorter distances from bulk power substations to distribution substations. The transmission system, which is usually 132 to 765 kilovolts (kV), and the sub-transmission system, which is usually 34 to 132 kV, consist of:
- Insulated wires or cables for transmission of power
- Transformers for converting from one voltage level to another
- Protective devices, such as circuit breakers, relays, communication and control systems
- Physical structures for containing the foregoing, such as transmission towers and substations
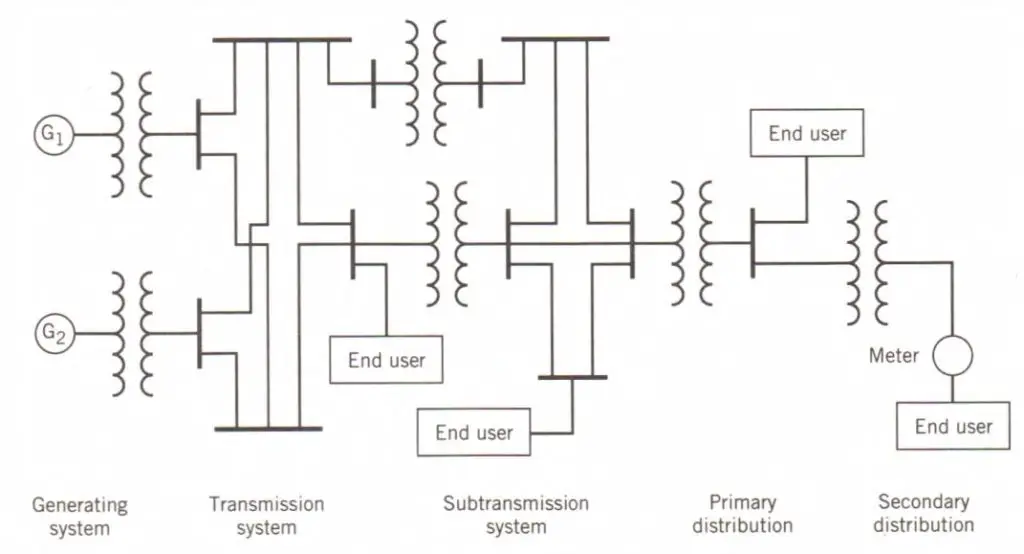
Figure 1. Simple power system structure.
Distribution System
The distribution of electric power includes that part of an electric power system below the sub-transmission level, that is, the distribution substation, primary distribution lines or feeders, distribution transformers, secondary distribution circuits, and customers’ connections and meters.
The substation contains a transformer to bring the voltage down from sub-transmission to distribution levels. Distribution voltages are typically 4 to 34 kV. Each substation transformer serves one or more feeders.
The primary distribution system extends from the distribution substations to the distribution transformers. A distinction is made between main feeders, which are connected to the substation, and lateral feeders, which are connected to the main feeders. These main feeders and laterals are illustrated in Figure 2.
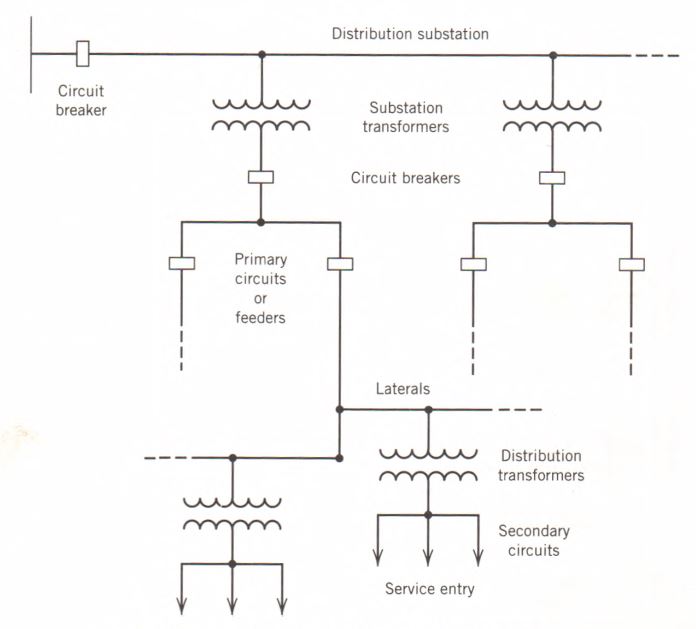
Figure 2. Electric Power distribution system components.
Each feeder is equipped with a circuit breaker or reclosure to protect itself and the substation transformer against damage by short-circuit currents. Beyond the substation, the primary feeder consists of underground cables or overhead lines to transport the power and associated devices to control and protect the feeder. These include switches, capacitors, fuses, voltage regulators, sectionalizers, reclosures, and step-down distribution transformers.
Many transformers are connected to the primary feeder for stepping voltage levels down to customer levels, which are 240, 208, or 120 V. The distribution transformers serve the secondary distribution system, which has small conductors connecting 1 to 10 residential customers to each distribution transformer.
Depending on the size of their power demand, customers may be connected to the transmission system, sub-transmission system, primary distribution, or secondary distribution. Each customer is connected to the power system through a meter.
Radial System
The primary distribution circuits in central business districts of large urban areas consist of underground cables that are used to interconnect the distribution transformers in an electric network. With this exception, the primary system is most often radial; that is, it constitutes a tree. For additional security, it is quite frequently loop-radial:
The main feeder loops through the load area and comes back to the substation.
The two ends of the loop are usually connected to the substation by two separate circuit breakers. A loop-radial configuration provides a backup capability. Opening selected sectionalizing switches results in a radial configuration that is used for normal operation. When a failure occurs in any section served by a radialized feeder, that section is isolated, and the other part of the loop can be used to supply the unaffected customers downstream of the faulted section.
Electric Energy Production
Most of the electric power in the United States is generated in steam-turbine plants. Water power accounts for less than 20% of the total, and that percentage will drop because most of the available sources of water power have been developed. Gas turbines are used to a minor extent for short periods when a system is carrying a peak load.
Coal is the most widely used fuel for steam plants. Nuclear plants fueled by uranium account for a continually increasing share of the load, but their construction is slow and uncertain because of the difficulty of financing the higher costs of construction, increasing safety requirements, public opposition to the operation of nuclear plants, and delays in licensing.
There is some use of geothermal energy in the form of steam derived from the ground in the United States and other countries.
Solar energy, still mainly in the form of direct heating of water for residential use, should eventually become practical through research on photovoltaic cells. Great progress has been made in increasing the efficiency and reducing the cost of these cells, but there is still a long way to go.
Electric generators driven by windmills are operating in a number of places, and they supply small amounts of energy to power systems. Efforts to extract power from the changing tides and from waves are underway. An indirect form of solar energy is alcohol obtained from grain and mixed with gasoline to make an acceptable fuel for automobiles. The synthetic gas made from garbage and sewage is another form of indirect solar energy.
Transmission and Distribution
The voltage of large generators in the power system is usually in the range of 13.8 to 24 kV. Large modem generators, however, are built for voltages ranging from 18 to 24 kV. No standard for generator voltages has been adopted.
Generator voltage is stepped up to transmission levels in the range of 115 to 765 kV. The standard high voltages (HVs) are 115, 138, and 230 kV. Extra-high voltages (EHVs) are 345, 500, and 765 kV.
Research is being conducted on lines in the ultra-high-voltage (UHV) levels of 1000 to 1500 kV. The advantage of higher levels of transmission voltage is apparent when consideration is given to the transmission capability in megavolt-amperes (MVAs) of a line.
The capability of transmission lines varies with the square of the voltage. The capability is also dependent on the thermal limits of the conductor, the allowable voltage drop, reliability, and the stability requirements for maintaining synchronism among the machines of the system. Most of these factors are dependent on line length.
High-voltage transmission usually employs overhead lines supported by steel, cement, or wood structures. At present, the application of underground transmission is negligible in terms of the total length of transmission lines. This is primarily because of the much higher investment, as well as repair and maintenance, costs of underground compared to overhead transmission.
The use of underground cables is mostly confined to heavily populated urban areas or wide bodies of water.
The first step down of voltage from transmission levels is at the bulk-power substation, where the reduction is to a range of 34.5 to 138 kV, depending on the transmission voltage. Some industrial customers may be supplied at these voltage levels.
The next step down in voltage is at the distribution substation, where the voltage on the transmission lines leaving the substation ranges from 4 to 34.5 kV and is commonly between 11 and 15 kV. This is the primary distribution system. A very popular voltage at this level is 12 kV (line-to-line). This voltage is usually described as 12-kV Y/7.2-kV ∆.
Most industrial loads are fed from the primary system, which also supplies the distribution transformers providing secondary voltages over single-phase, three-wire circuits for residential use. Here the voltage is 240 V between two wires and 120 V between each of these and the third wire, which is grounded. Other secondary circuits are three-phase, four-wire systems rated 208-V Y/120-V A or 480-V Y/277-V ∆.
Electrical Load Characteristics
The ultimate objective of any power system is to deliver electrical energy to the consumer safely, reliably, economically, and with good quality. Operation of the power system requires that proper attention is given to the safety not only of the utility personnel but also of the general public.
At the consumer load centers, electrical energy is converted to other more desirable and useful forms of energy. This implies that the supply of electricity should be available where, when, and in whatever amount the consumer requires.
The quality of the supplied electrical energy is partially dependent on energy usage by the consumers. When there is a high demand on the limited capabilities of the power system, the voltage may deviate from its acceptable levels.
Switching of large machinery could cause fluctuation of the voltage as well as the frequency. Unusually high and prolonged demands may lead to overloaded equipment, which may cause tripping of protective devices to prevent further damage to the equipment.
Finally, the power system must be operated such that the overall costs of producing electricity, including all attendant losses in the generation and delivery systems, are minimized. The most economical conditions derive not only from proper operating procedures but also from efficient system planning and design.
Electrical loads are commonly grouped into four categories: residential, commercial, industrial, and other.
These are sometimes subdivided into subgroups depending on their usage levels, for example, residential A, B, or C.
The residential loads are private homes and apartments. They include lighting, cooking, comfort heating and cooling, refrigerators, water heaters, washers and dryers, and many more different appliances.
Commercial loads include office buildings, department stores, grocery stores, and shops.
Industrial loads consist of factories, manufacturing plants, steel, lumber, paper, mining, textile, and other industrial factories.
In both commercial and industrial groups, loads include lighting, comfort heating and cooling, and various types of office equipment. In addition, industrial loads contain various types and sizes of motors, fans, presses, furnaces, and so on.
Electrical load refers to the amount of electrical energy or electrical power consumed by a particular device or by a whole community.
It is also referred to as electrical demand. At the individual consumer level, the electrical demand is quite unpredictable. However, as the demands of the various users are accumulated and added at a feeder or a substation, they begin to exhibit a definite pattern.
Load Curve
A typical plot of the electrical load is shown in Fig. 3, and it is referred to as a load curve. The period of interest is normally 1 day; thus, it is called a daily load curve. The daily load curve shows the kilowatt demand from midnight to noon to midnight.
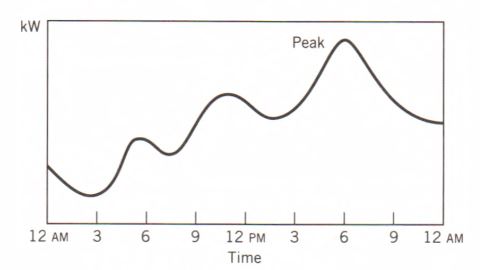
Figure 3. A typical load curve.
The daily load curves for Monday through Friday are similar in shape and maximum values. Weekend load curves are generally different, particularly for industrial and commercial customers, because of the shutdown of operations on Saturdays and Sundays.
Load curves may be constructed for feeders, substations, generating plants, or for the whole system. Load curves are also drawn for different periods or seasons of the year. Thus, the system peak load for summer or winter may be read as the highest ordinate from the corresponding load curve.
Load Duration Curve
The daily load curves may be accumulated for a whole year and presented in another curve called the annual load duration curve (LDC). A typical load duration curve is shown in Fig. 4.
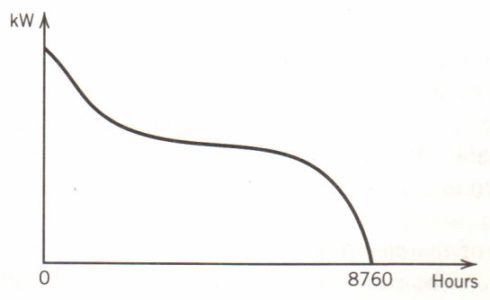
Figure 4. Load Duration Curve
The LDC shows the 8760 hourly loads during the whole year, although not in the order in which they occurred. Rather, the LDC shows the number of hours during which the load exceeded a certain kilowatt demand. If the area under the LDC curve is calculated and divided by the total number of hours, the average demand is determined.
Key Takeaways
This article provides a comprehensive overview of electrical power systems, covering generation, transmission, distribution, and load characteristics. It highlights the importance of reliability, safety, and efficiency in delivering electrical energy to consumers. By exploring the structure and operation of power systems, as well as the characteristics of electrical loads, this article offers valuable insights into the essential components and functioning of modern electrical grids.